Relationships: Cooling Tower
Note: These figures were generated from v1 data.
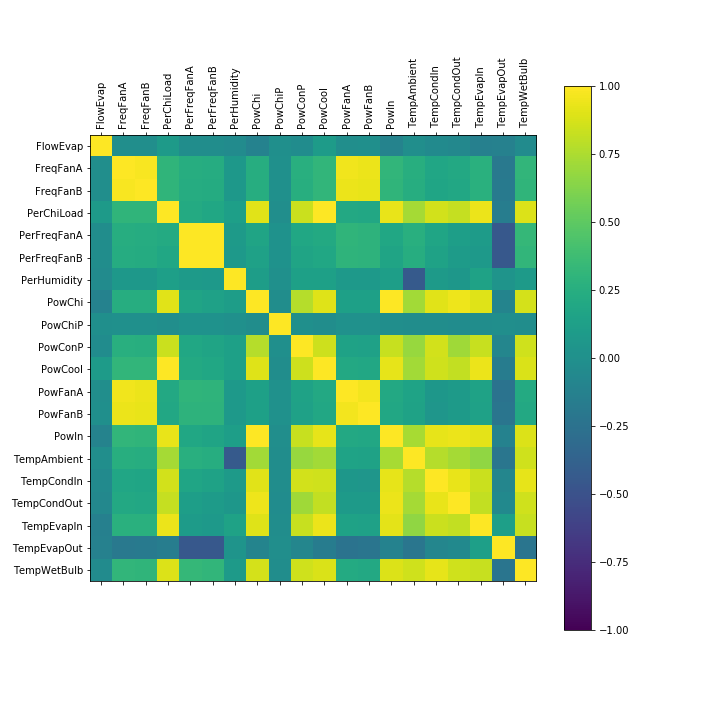
Correlations
Cross-correlation
The Pearson product-moment correlation was calculated for each pair of variables:
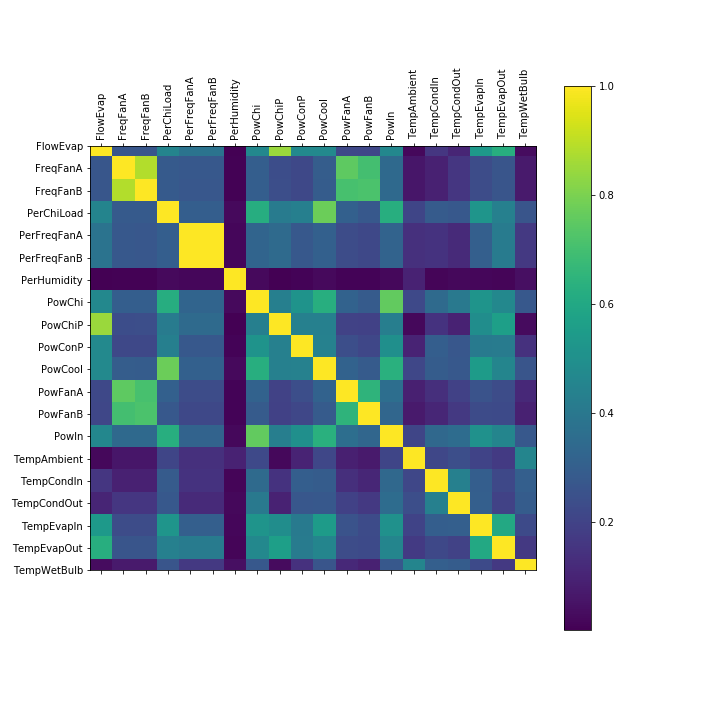
Mutual-information
Normalized mutual information was calculated for each pair of variables. A value of 0 indicated no relationship. A value of 1 indicated perfect predictive ability between the two variables.
###
Causality
Vector auto-regression
TODO
Granger causality test
TODO
Clustering
The features are clustered to extract if there are any separate modes of operation.
Temperature
Cooling tower measurements are clustered using DBSCAN on TempAmbient, TempWetbulb, and DeltaTemp = TempCondOut - TempCondIn. The following animation shows clustering results:
All three temperature measurements occupy a planar space. Deviation from the plane can be used as a basis for identifying anomalous operation.
Power
Cooling tower measurements are clustered using DBSCAN on PowConP, PowFanA, and PowFanB. The following animation shows clustering results:
On default options, no clusters are found. However, most of the power states are distributed along high power consumption for the two fans. The condenser water pump shows an even distribution across measurements. In this case, the concentration around high fan power makes sense as the source data mostly had fan power set to 100% of maximum frequency.